
Most dating operators either ignore analytics or drown in them. Both fail. Analytics matter, but only the right ones, read honestly. This guide sets out what to measure, what to ignore, and how to use the numbers to actually run a dating app.
Why analytics matter, and the trap
Analytics matter because running a dating app on intuition alone is guessing. The numbers tell you where members arrive, where they get stuck, where they leave, and whether the business is compounding. Without them, an operator cannot tell a fixable problem from an unfixable one, or a working channel from a wasteful one.
But there is a trap, and many operators fall into it. The trap is mistaking measurement for insight: collecting dozens of metrics, watching a busy dashboard, and feeling informed while learning nothing. A dashboard full of numbers is not analytics. Analytics is knowing which few numbers genuinely tell you whether the app is healthy, and acting on them.
So the goal of this guide is not a long list of everything you could measure. It is a clear sense of the metrics that matter, why each one matters, and which two or three you should watch above all the others.
The dating funnel
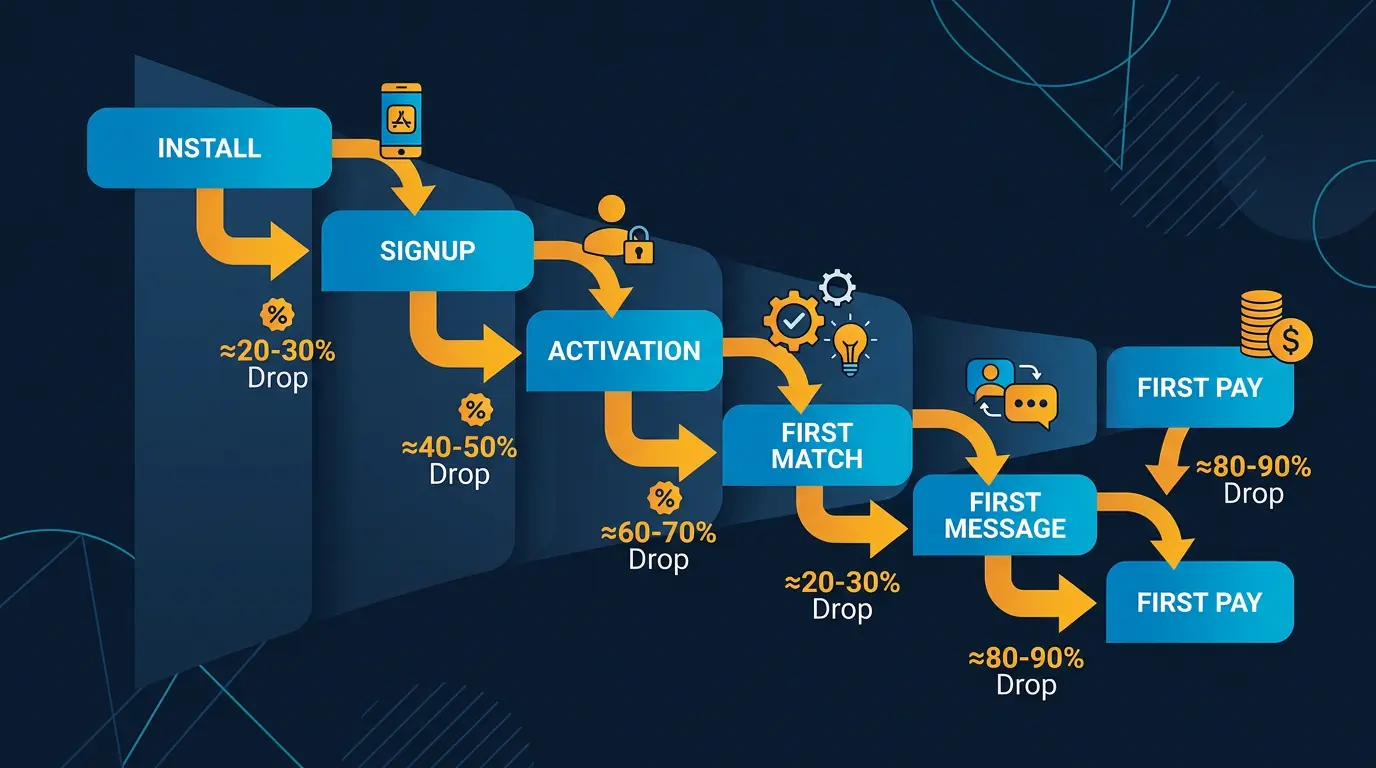
The single most useful frame for dating analytics is the funnel, because it organises every metric into a logical sequence.
A member moves through stages: they are acquired, arriving at the app; they activate, completing a profile and having a first real experience; they engage, using the app and matching; they convert, becoming a paying member; and they retain, or do not. Each stage has metrics, and each stage is a place where members are lost.
The power of the funnel view is that it turns a vague problem, "the app is not growing," into a specific one, "members activate fine but do not convert," or "conversion is fine but retention is poor." Once you know which stage is leaking, you know what to fix. Always read dating metrics as a funnel, because an isolated number means little, but a number's place in the funnel means everything.
Acquisition metrics
Acquisition metrics measure members arriving at the top of the funnel.
The metrics that matter are the volume of new members, broken down by channel, so you know where members come from; and the cost to acquire them, the cost per signup and, more importantly, the cost per paying member, by channel. Cost per paying member is the one that counts, because a channel that brings cheap signups who never pay is worse than a channel that brings fewer, more expensive signups who do.
The acquisition question analytics should answer is simple: which channels bring members who become genuinely valuable, and at what cost. An operator who knows that can put budget where it works. An operator who only knows total signups is flying blind on the most expensive part of the business.
Activation metrics
Activation is the stage where a new arrival becomes a real, engaged member, and it is one of the most important and most neglected parts of the funnel.
The metrics that matter are profile completion rate, the share of signups who finish a usable profile; and early-experience milestones, especially whether a new member reaches a first match or a first conversation, ideally soon after joining. A member who gets a match in their first day or two is far more likely to stay than one who does not.
Activation matters because a member who never activates is, in effect, an acquisition cost wasted: you paid to bring them in and they never reached the value. Weak activation quietly destroys the economics. If activation metrics are poor, the fix is usually in onboarding, and it is one of the highest-return things an operator can improve.
Engagement metrics
Engagement metrics measure how actively members use the app between joining and converting or churning.
The standard engagement metrics are active users, measured daily and monthly, and the ratio between them, which indicates how habitually members return; session frequency and length; and the volume of core actions, profiles viewed, likes, matches, messages sent.
Engagement matters because it is the leading indicator of both conversion and retention: members who engage are far more likely to pay and to stay. But engagement must be read with judgement. The goal of a dating app is, somewhat unusually, to help members succeed and therefore eventually leave, so extremely high engagement is not automatically good if it means members are stuck rather than succeeding. Read engagement as a sign of a healthy, useful app, not as an end in itself.
Conversion and revenue metrics
Conversion and revenue metrics measure whether engagement turns into money.
The core metrics are the free-to-paying conversion rate, the share of members who become paying subscribers; average revenue per user; and lifetime value, the total an average member is worth over their time on the app. Lifetime value, set against the cost to acquire a member, is the metric that tells you whether the business model genuinely works.
The free-to-paying conversion is one of the two or three most important numbers in the whole app, because it sits at the hinge between an engaged audience and a revenue-generating one. An app with strong engagement but weak conversion has a monetisation problem; an app with strong conversion has a working model. Watch the conversion rate closely, and watch lifetime value against acquisition cost as the ultimate test of viability.
Retention metrics
Retention is the metric that decides whether a dating app compounds or stalls, and it deserves particular attention.
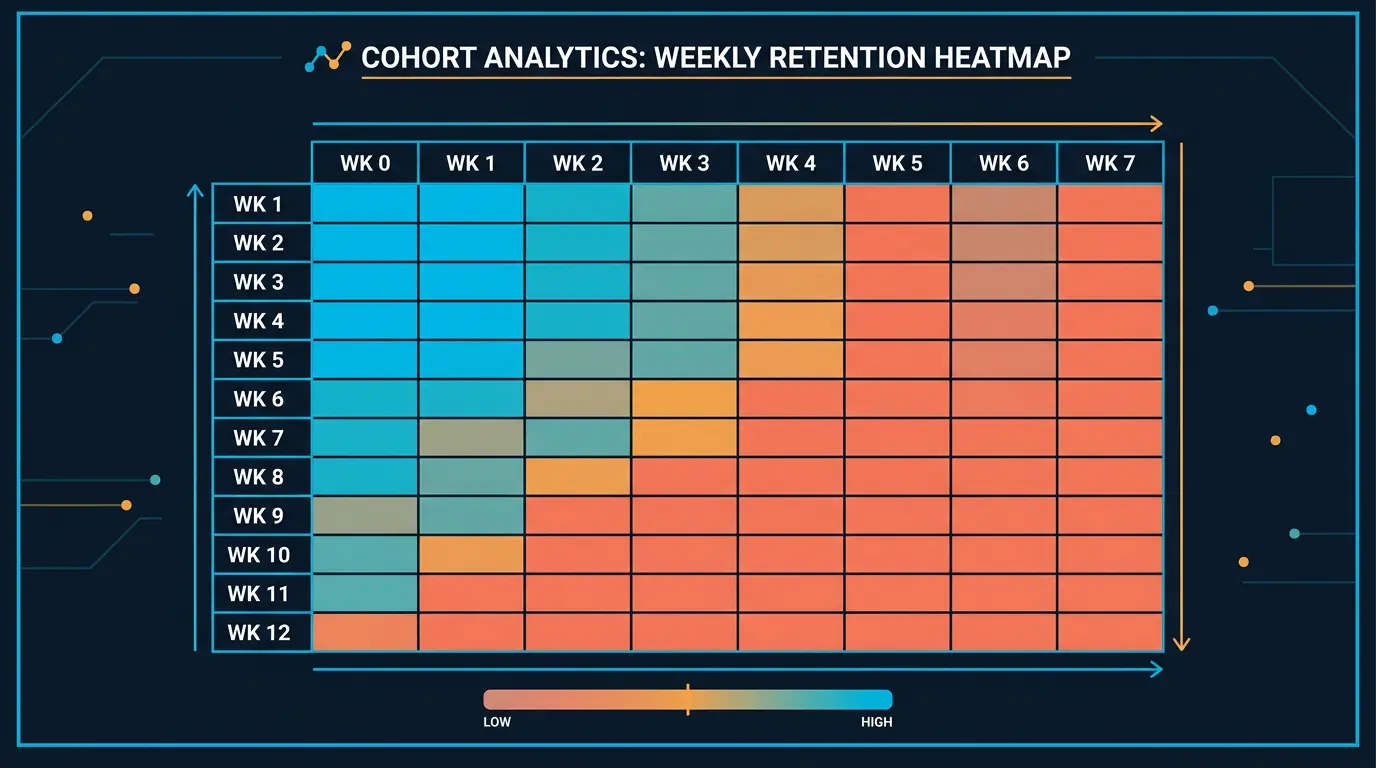
The right way to measure retention is by cohort: take the members who joined in a given period and track what share are still active, and still paying, after one month, three months, six months. Cohort retention reveals the genuine shape of the business in a way that a single overall figure cannot.
Retention matters because the dating revenue model compounds through members who stay. Each month's new members add to a base of retained earlier members, and small improvements in retention produce large improvements in revenue over a year. It also has a dating-specific subtlety: some members leave because they succeeded and found a partner, which is a good outcome, not churn. Distinguish, where you can, between members who leave satisfied and members who leave disappointed, because they mean opposite things.
Dating-specific health metrics
Beyond the standard funnel, dating apps have health metrics specific to the category, and these often explain what the standard metrics only describe.
Match rate measures how often members who interact actually match. Message rate measures how many matches turn into a first message. Conversation rate measures how many of those become real conversations. Together these reveal whether the core dating experience is actually working: an app can have good engagement metrics while these are poor, which means members are active but not succeeding.
The balance of the member base is another crucial dating-specific metric. Many dating apps depend on a reasonable balance between the groups members are seeking, and a badly imbalanced base, far more of one group than the other, produces a poor experience for the majority and quietly undermines everything else. Watching the composition and balance of the member base is genuinely a health metric.
These dating-specific metrics are often the most diagnostic of all, because they measure whether the app is doing the one job it exists to do.
Vanity metrics to ignore
Some numbers look impressive and tell you almost nothing, and an operator should consciously discount them.
Total downloads or total registered members is the classic vanity metric: a large cumulative number that includes everyone who ever signed up, most of whom are long inactive. It feels good and means little. Total page views, raw social media followers, and other large cumulative counts are similar.
The test for whether a metric is vanity or real: does it connect to genuine value and to a decision. Total downloads connects to neither, you cannot act on it and it does not reflect a healthy business. The free-to-paying conversion connects to both. Discount the metrics that only flatter, and spend your attention on the metrics that genuinely tell you whether the app works and what to do about it.
Tooling and what white label provides
An operator does not need to build an analytics system, and on much of it comes provided.
A white label platform typically supplies a dashboard with the core metrics, members, activity, conversions, revenue, so the operator has the essential numbers without any setup. Beyond that, operators often connect their own analytics tools to see the acquisition side, traffic and channel data, in one place, and some use the platform's API, where available, to pull data into a combined view.
The realistic approach for most operators is to use the platform's built-in reporting for the in-app funnel, add a standard analytics tool for the acquisition side, and resist the urge to build elaborate dashboards. The constraint on good analytics is almost never the tooling; it is the discipline to watch the few metrics that matter and act on them. Confirm what reporting your white label provider gives you, and build the smallest analytics setup that answers the real questions.
Turning analytics into decisions
Every section of this guide has ended on the same note: measure, then act. That instruction is easy to write and surprisingly hard to follow, so it is worth treating the act of acting as a discipline in its own right.
The first part of the discipline is a regular rhythm. Analytics only changes a business if someone looks at it on a predictable cadence and asks what it means. A weekly look at the core funnel and the dating-specific health metrics, and a slightly deeper monthly look that includes cohort retention, is enough for most operators. The point of a fixed rhythm is that it forces the question. Numbers that are only checked when something already feels wrong are numbers that arrive too late to prevent the problem.
The second part is to read the numbers as a diagnosis, not a scoreboard. The useful question is never simply "is this number good or bad" but "what is this number telling me to do." A weak activation rate is not a verdict; it is a pointer to onboarding. A strong engagement number sitting beside a weak conversion number is not a contradiction; it is a clear instruction to look at monetisation rather than at engagement. The funnel exists precisely so that a vague worry becomes a specific, addressable task.
The third part is to change one thing at a time and watch the same metric. If activation is weak, change something specific in onboarding, then watch the activation rate over the following weeks to see whether it moved. Changing several things at once feels efficient and destroys the ability to learn, because when the number moves, nothing tells you which change moved it. Analytics and action together form a loop: measure, diagnose, change one thing, measure again. A business that runs that loop steadily compounds small improvements; a business that watches a dashboard without closing the loop simply watches.
The fourth part is patience with the timescale. Some metrics, especially retention, only reveal the effect of a change after weeks or months, because a cohort has to age before its retention can be read. An operator who expects every change to show up in the numbers next week will either abandon good changes too early or chase noise. Match the patience to the metric.
Read honestly, on a rhythm, as a diagnosis, and close the loop. That is the whole of good analytics practice, and it is worth more than any additional metric on the dashboard.
Common mistakes
The defining mistake is watching vanity metrics, total downloads and similar flattering numbers, and feeling informed while learning nothing actionable.
The second is drowning in metrics, collecting dozens and watching a busy dashboard without knowing which few genuinely decide the app's health.
The third is ignoring the funnel and reading metrics in isolation, so a problem stays vague instead of being located at a specific stage.
The fourth is neglecting activation and the dating-specific health metrics, which are often the most diagnostic of all. The fifth is measuring without acting, treating analytics as reporting rather than as the basis for decisions. Watch a small set of genuinely meaningful metrics, read them as a funnel, and change something in response.
What to read next
For the engagement levers, read dating app onboarding flows that convert and dating app push notifications. For the revenue side, see dating KPIs and benchmarks. And to see what analytics a platform provides, DatingPartners.com can walk through its reporting.
DatingPartners reporting shows every KPI above in real time. See the dashboard.
Visit DatingPartners.com →